Caloric Bar Graph in the Student Center Food Court
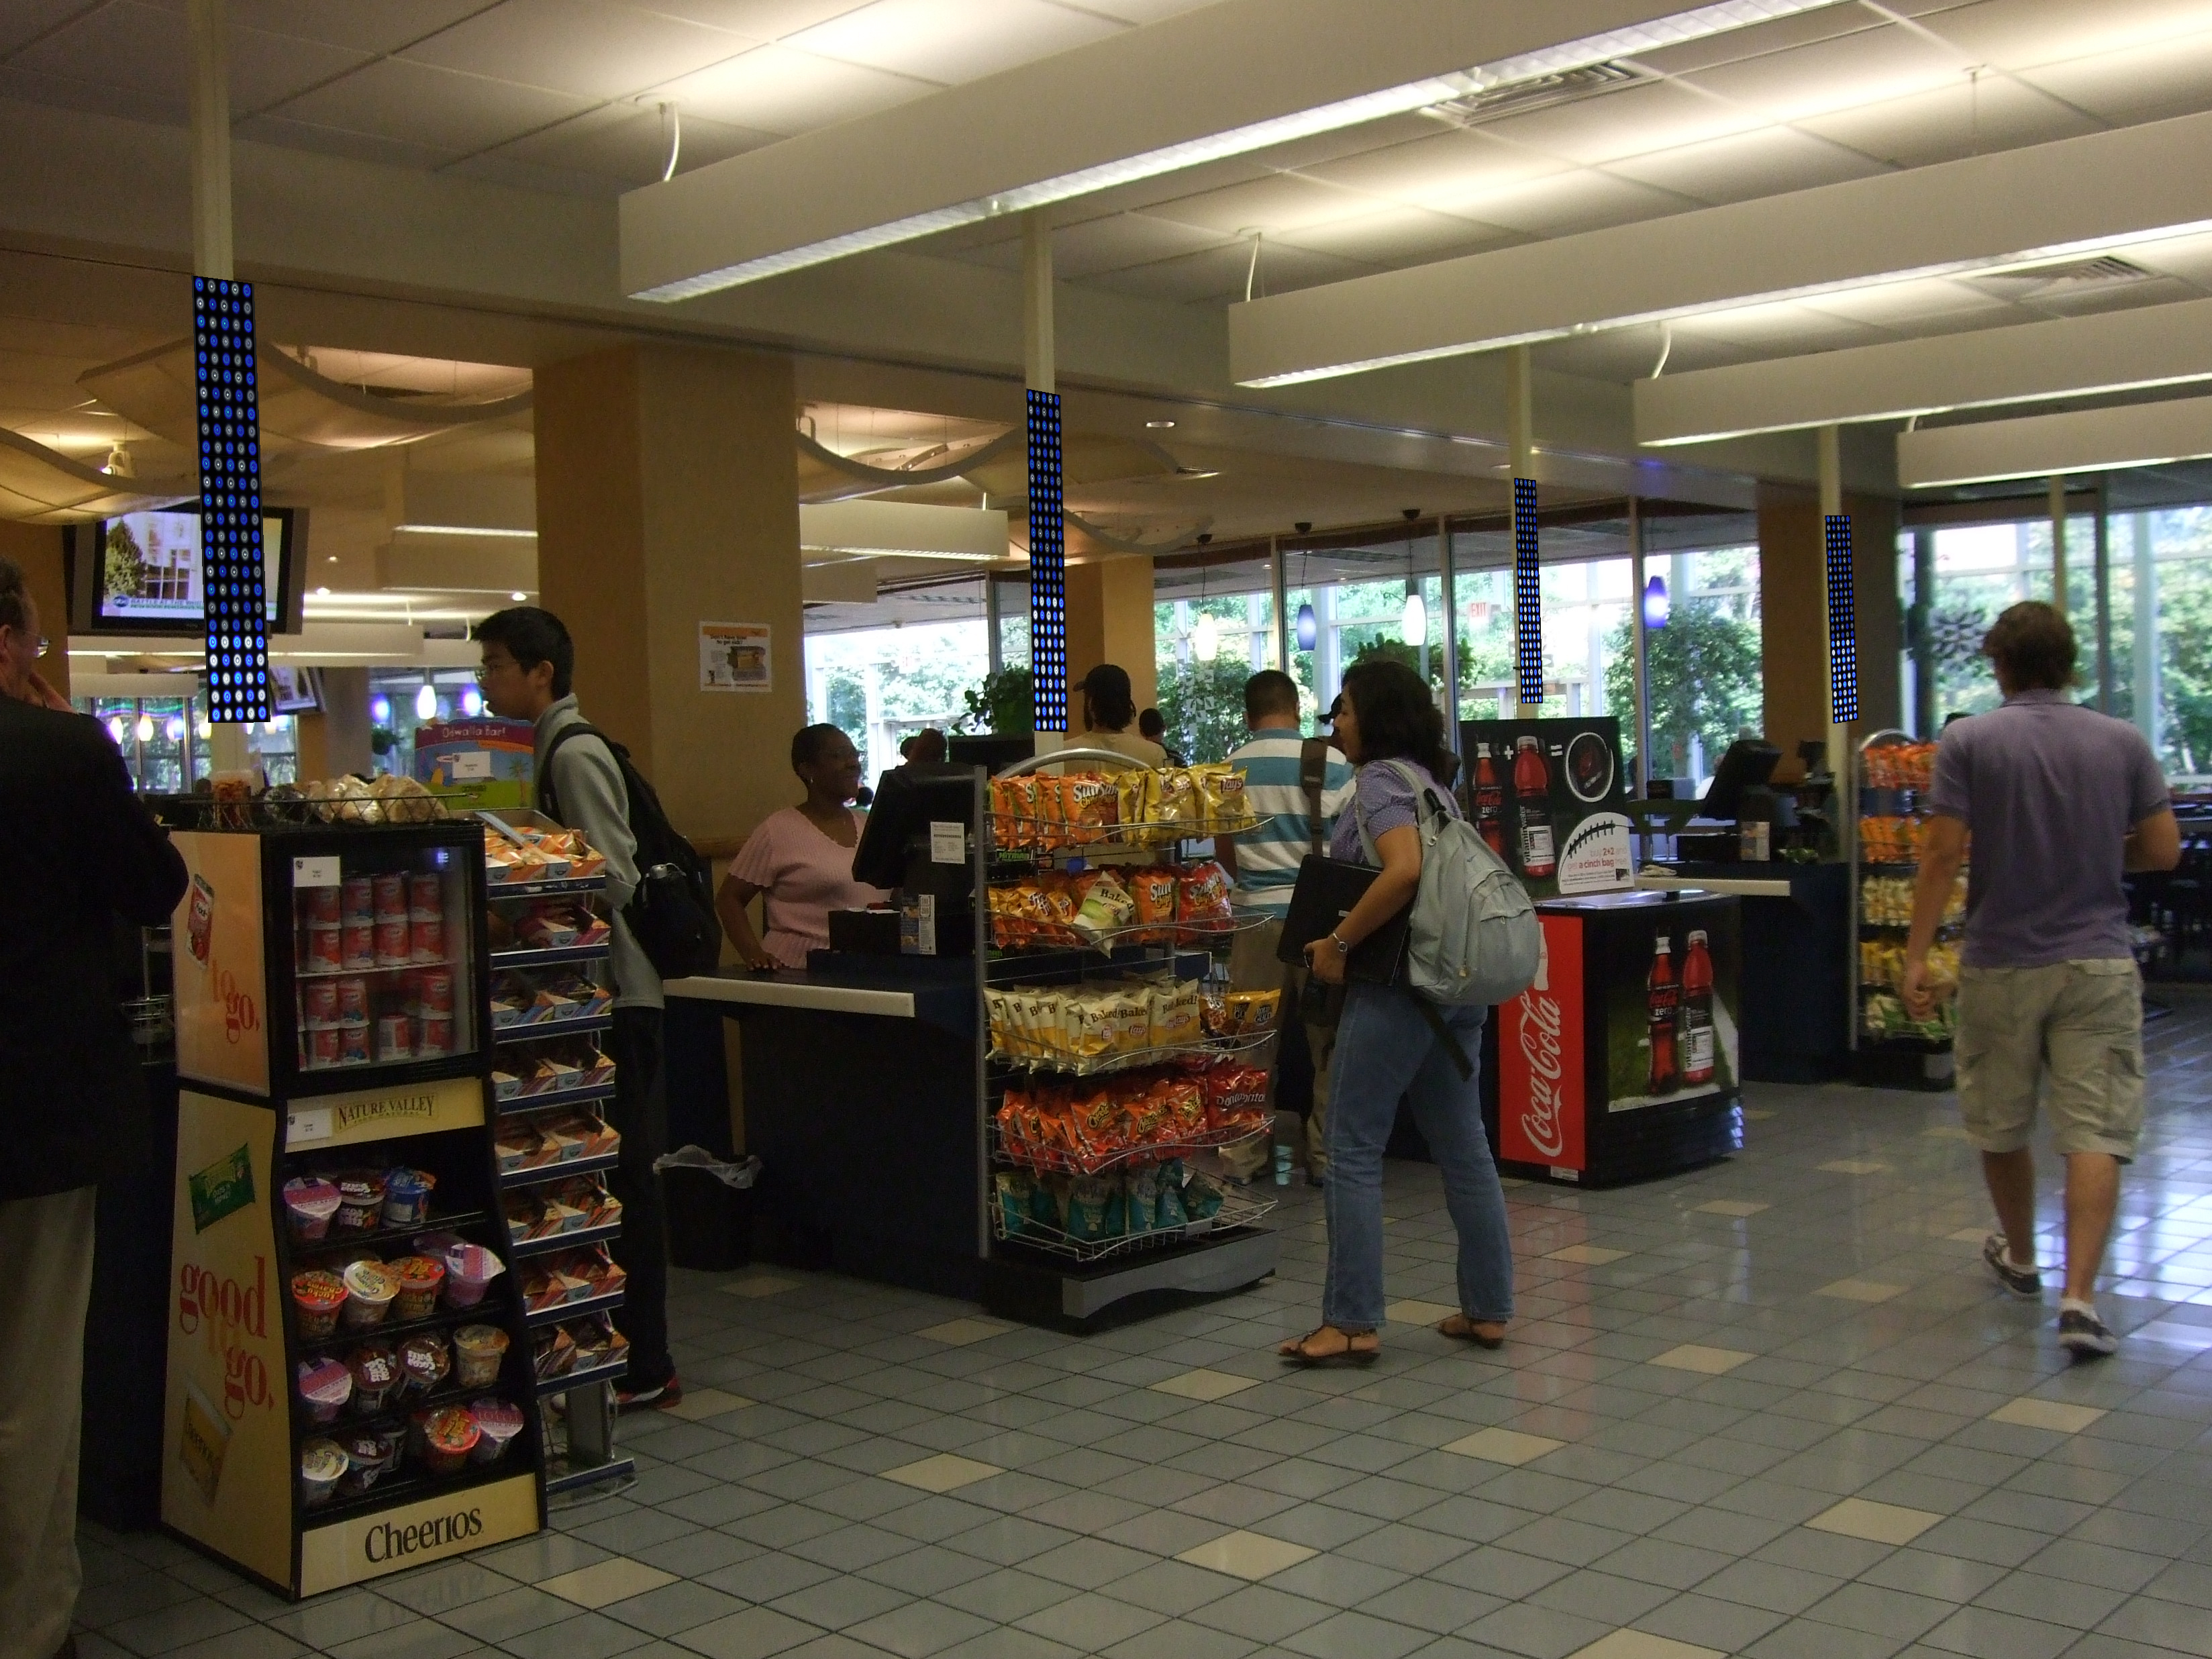
September 28th, 2010 By Nick PoirierThe purpose of my idea is to create a method for making people think more about what they eat by altering the space in which they eat. Customers would pay at specific registers based on the caloric content of their order. Above the registers, a light up led grid would display the number of transactions on that register. By the end of the day, or week, the grids would form a bar graph showing the average caloric intake of the Georgia Tech community. Over time, changes in the bar graph would show changes in eating habits.